- EdTech · SAT
- Production
- 12K+ users
Prep4u
Researched, designed and built end to end the diagnostics, practice and retention layer of a Digital SAT prep platform with 12,400+ learners: a Readiness Engine that predicts scores, a multistage adaptive placement test and a sales retention CRM.
Visit the live site (opens in a new tab)- Role
- Full-stack · led 2 developers
- Team
- 3–6 people
- Timeline
- 01/2026 – 08/2026
- Status
- In production
12.4K+
Registered users
~110K
Questions in the bank
6
Features owned end to end
30
REST APIs in the CRM
 Laravel
 Livewire
 Alpine.js
 MySQL
MySQL Redis
Redis

Context
Prep4u is a Protean Studios product: a test-prep platform centred on the Digital SAT (plus IELTS, the national high-school exam and university aptitude tests), with a web app and a mobile app, sold as Start / Focus / Master subscriptions. It runs on a large Laravel monolith in production — about 535 routes, 178 models, 411 Livewire components and ~6,800 commits since 2023 from more than ten developers.
I worked on it from January to August 2026 and owned the features for skill diagnostics, learning analytics and retention.
Problem
Three gaps, on three sides of the product:
- Learners practised a lot without knowing how ready they were, what score to expect or which skills held them back — so practice was scattered and motivation dropped.
- New users had no quick way to find their level, which weakened onboarding and the path to a paid plan.
- Sales and product could not measure retention consistently, did not know which subscribers were about to churn, and sales had no way to decide who to contact today, what to say, or whether the outreach worked.
My Responsibility
I researched, designed the algorithms for, and built end to end six features — business analysis, algorithm and database design, backend and APIs, Livewire UI, GA4 tracking, production deployment and hotfixes:
- Readiness Engine — a 0–100 SAT readiness score and a 400–1600 score prediction.
- Weakness Map — weakness analysis over the skill tree.
- Placement Test — a multistage adaptive entry test in the Digital SAT format, plus a 16-question Quick Diagnostic.
- Retention Metrics Dashboard — D1/D7/D30 cohort retention.
- Sale Retention CRM — my own proposal: a prioritised daily outreach queue for the sales team.
I also led two developers: splitting tasks, reviewing code and designing solutions.
Constraints
- Sparse data: many users had only taken a few tests, and raw accuracy is noisy (3 out of 3 correct is "100%").
- Gameable inputs: clicking through quickly or guessing can still produce good-looking numbers.
- One engine, many consumers: the web dashboard, the analytics services and the mobile API had to show the same number.
- A large production codebase shared by many developers, so reusing existing infrastructure (the SAT exam room) beat writing new.
- Infrastructure: Redis was shared by cache and sessions (flushing it would log everyone out), and no cron job updated subscription status.
- The full diagnostic takes 134 minutes, so dropped connections, closed tabs and timeouts mid-test were expected.
Architecture
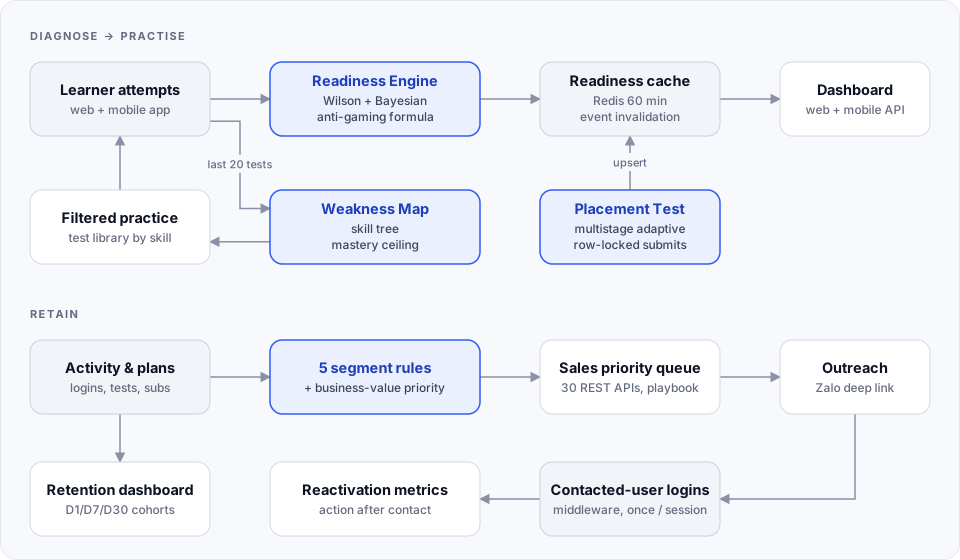
- The Readiness Engine is a singleton service that reads a learner's last 10 completed tests and caches the result in Redis for 60 minutes. A model observer on
UserQuizclears that cache only whenis_completedflips totrue. Results are stored inuser_readiness_cache(unique per user × exam type), a table shared with the Placement Test. The same engine serves the web dashboard,StudyInsightService,AdvancedAnalyticsServiceand the mobile API. - The Weakness Map reads the last 20 tests over a two-level skill tree. Every weak-skill card links straight to the test library filtered to that skill; the learner practises, and the new attempts flow back into the engine — a closed diagnose → practise loop.
- The Placement Test runs inside the existing SAT exam room: Reading & Writing Module 1 → Module 2 (Easy or Hard) → 10-minute break → Math Module 1 → Module 2 (Easy or Hard). Its result is upserted into
user_readiness_cachewithassessment_source = 'full_diagnostic', and dashboards prefer the placement score over the practice-based estimate. The Quick Diagnostic branches off the same infrastructure withexam_type = 'quick'. - Retention and CRM: cohort queries feed nine dashboard endpoints; five segment rules feed a priority score, the priority-queue API, sales assignment and a Zalo deep link; a middleware records logins of contacted users so reactivation can be measured.
Key Technical Decisions
Cautious score prediction: Wilson lower bound + Bayesian smoothing
- Problem: with few answers, raw accuracy swings wildly and inflates the predicted score.
- Decision: combine the Wilson score lower bound (95% confidence) with Bayesian (Laplace) smoothing, blended by data confidence
c = min(1, N/50), with a bonus or penalty from hard-question accuracy. The predicted range narrows from ±150 to ±30 over the first 100 questions, with five confidence levels. - Why: learners with little data get a cautious estimate and a wide range; learners with plenty get a score close to reality — and both can see how confident it is.
- Trade-off: new learners see a lower score and a wider range than they hoped. I answered that with specific guidance ("answer N more questions to unlock a higher score") instead of loosening the formula.
Anti-gaming built into the formula
- Problem: fast clicking or guessing must not push the score up.
- Decision:
Readiness = Accuracy×0.55 + Volume×0.15 + HardAccuracy×0.25 + Time×0.05, with weights inconfig/readiness.php.- Accuracy penalties: below 50% ×0.3, below 60% ×0.5.
- Volume counts correct answers only (target 68.6 = 98 questions × 70%), with a confidence factor for the number of tests.
- The time score only uses time spent on correct answers, weighted by difficulty (0.5 / 1.0 / 1.5).
- A five-step volume ceiling: under 20 questions caps readiness at 20 … only 200+ questions can reach 100.
- Why: each way of gaming the score is neutralised by one component, instead of a separate check that can be worked around.
- Trade-off: the formula is harder to explain, so I also built an admin Readiness Debug tool: every score component, penalty and ceiling, per-test accuracy, and a response-time histogram (the ≤5-second bucket flags spam clicking). Support uses it to explain scores; I used it to tune the weights.
Event-driven cache instead of a short TTL
- Problem: computing readiness takes many queries, yet learners must see the new score right after finishing a test.
- Decision: cache in Redis for 60 minutes and invalidate from a model observer when a test becomes completed.
- Trade-off: one more place where the invalidation logic must stay right; in return there is no wasted recomputation and no stale score.
Placement Test: multistage adaptive rather than per-question adaptive
- Problem: the diagnostic had to feel like the real Digital SAT and still estimate ability.
- Decision: two-stage multistage adaptive testing, like the real exam. After each Module 1, ability θ (−3 to +3) is estimated from difficulty-weighted accuracy (easy 0.8, medium 1.0, hard 1.25); θ ≥ 0.5 routes to the Hard Module 2. URLs never reveal the branch (users only see
rw-module-2; the server maps it to Easy or Hard) and earlier modules cannot be revisited. - Why: it matches the real format, reuses the existing exam room (timer, review, highlighting, Desmos) and needs no per-question IRT calibration.
- Trade-off: the estimate is less precise than CAT/IRT, and the pool currently matches the blueprint exactly, so every user gets the same questions.
No race conditions on submission
- Problem: double submits, multiple tabs and flaky networks while saving answers and finishing modules.
- Decision: save answers and finish modules inside a DB transaction with
lockForUpdateon the session row; reject duplicate answers and check session ownership. Batch submit: answers stay in localStorage and are sent once at the end of the module, each saved in its own transaction to reduce lock contention. Blank answers count as wrong. - Trade-off: unsent answers live on the client until the module ends, covered by auto-submit on timeout, resume from the intro, dashboard or URL, and cleanup of stale state.
CRM: explainable rules and a priority score, not a model
- Problem: sales needed to know who to call first today, and why.
- Decision: five ordered segment rules (CANCEL_RECENT, EXPIRED_RECENT, CHURN_RISK, SILENT_SUBSCRIBER, POTENTIAL_BUYER) and a business-value priority score (days inactive, recent cancellation, plan tier and price, low practice, declining activity); POTENTIAL_BUYER gets its own formula that favours active users. Scores are computed in bulk with four pre-fetch queries to avoid N+1.
- Why: there was not enough data for machine learning, and sales and managers can read and adjust rules.
- Trade-off: weights have to be tuned by hand from sales feedback.
Retention on a fixed cohort
- Problem: naive calculations produced D30 above D7, or counted cohorts that had not been observed long enough.
- Decision: rolling retention on one fixed cohort — users whose first test was 31–61 days ago — so every D-value uses the same cohort, D1 ≤ D7 ≤ D30 always holds, and right-censoring is handled; alongside GA-style exact retention (D1/D7/D14/D30) and a 12-week trend.
Log only what the metric needs
- Decision: a middleware records a login event only for users sales has contacted, once per session (
last_login_atis always updated). - Why: the event table stays small while still measuring "action after contact" and 7-day reactivation.
Trade-offs
- Multistage vs CAT/IRT: simple, faithful to the format and reuses the exam room, at the cost of estimate precision.
- Rules vs machine learning for segments and priority: transparent and workable with little data, but tuned by hand.
- Trigger Engine, phase 1: four condition types and four action types are designed, but the Zalo, email and voucher actions only log for now, and Zalo outreach is semi-automatic (a personalised message plus a deep link) — faster to launch, not yet fully automated.
- Tier gating on the results page supports upselling (Weakness Map and roadmap for paid plans, AI Coach for Focus/Master), while free users still get the predicted score and level.
- Now vs later: rolling retention still runs
exists()per user — fine at the current scale, worth optimising as it grows.
Implementation Highlights
- Readiness: accuracy by difficulty comes from a single grouped SQL query over
user_quiz_details ⨝ questions; ideal answer times are derived from the real test structure (quiz_sections), with a 1.13 medium factor calibrated on measured data (93 s vs 82 s). A planning layer estimates weekly score gains, rates a target as "achievable" or "stretch" against the exam date, and generates a three-phase roadmap and coach comments. - Weakness Map: accuracy weighted by difficulty (1 / 1.5 / 2) and by recency (linear decay from 2× to 0.5×); a four-level mastery ceiling (only easy questions caps mastery at 50%, …) with the reason shown in the UI ("needs more hard questions (1/3)"); a 0–100 risk score; five skill states; categories with under 30% coverage marked critical; noise thresholds. Sub-skills lazy-load in Livewire, and ten GA4 events measure the funnel from view to skill click to practice.
- Placement Test: a six-module blueprint spread across eight SAT skill domains, a 147-question pool with no overlap; 98 questions (27/27/22/22) in 134 minutes; section score
200 + 600 × weighted accuracy(±80). A seeder builds the pool from the 300 newest tests, over-samples 3× per blueprint cell and prints a verification report; every calculation on the results page has a fallback. The Quick Diagnostic reuses the sessions, exam room and submission pipeline and shipped in about a week. - Sale Retention CRM: five new tables (~20 indexes) and nine event types; a priority queue with nine filters; a configurable playbook (scripts per segment, four target KPIs, six Zalo templates with 16 variables);
retention:auto-assign --dry-run --segment;retention:validate-data --sync --fixfor go/no-go checks and a correlated-UPDATE backfill oflast_login_at; anExcludesTestAccountstrait reused in eight classes; role-based access middleware; 30 REST endpoints. - Retention Dashboard: nine JSON endpoints and four Chart.js tabs that load on open; pagination runs on IDs first and enriches only the current page, avoiding N+1; test accounts and unfinished attempts are excluded.
Result / Impact
- Everything runs in production on prep4u.vn for 12,400+ registered users.
- One Readiness Engine serves the web dashboard, the analytics services and the mobile API.
- The Placement Test and Quick Diagnostic became the onboarding and upsell funnel (tier gating, a
placement_test_completeevent). - Sales gets a prioritised daily outreach queue and can measure reactivation after contact.
What I Learned
- With sparse data, cautious but explainable beats falsely precise: a narrowing range and "answer N more questions" made learners trust the number.
- Anti-gaming belongs inside the model, not in a check bolted on afterwards.
- A debug tool built alongside the algorithm speeds up tuning for operations and for me.
- Measurement — GA4 funnels, post-contact events — has to be designed with the feature, not added later.
- Next steps I would take: randomise the placement pool, optimise rolling retention and the "action after contact" filter, and automate the Trigger Engine.